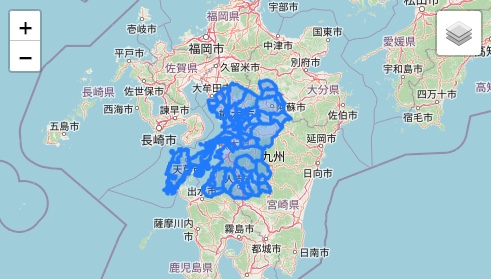
リーフレット(leaflet)は軽量、多機能、拡張性、スマホ対応している地図の機能を持った、JavaScriptライブラリです。この記事では、国土地理院が配布しているGeoJSON データを地図上に表示させて、コントロールレイヤーに追加する方法を確認していきます。
JS地図ライブラリ・リーフレットを使って特定の位置のマップを表示する
2023年01月10日
leafletファイル構成
/
|-- index.html
|-- style.css
|-- script.js
`-- resouces/
    `-- kumamoto.geojson
geojson データはこちらから入手することができます。
GeoJSON を地図上に表示、コントロールレイヤーに追加
const osm = L.tileLayer('https://tile.openstreetmap.org/{z}/{x}/{y}.png', {
    attribution: '© <a href="http://www.openstreetmap.org/copyright">OpenStreetMap</a>'
});

var baseLayers = {
    "openstreetmap": osm,
}

var map = L.map('myMap', {
    center: [32.639884, 130.987154],
    zoom: 8,
    layers: [osm]
})

var LayerControl = L.control.layers(baseLayers).addTo(map);

fetch("./resouces/kumamoto.geojson")
    .then((response) => response.json())
    .then((data) => {
        var kumamoto = L.geoJSON(data)
        map.addLayer(kumamoto)
        LayerControl.addOverlay(kumamoto, "Kumamoto")
});17 ~ 23 : 外部のGeoJSON ファイルを読み込見ます。
21 : 読み込み時に地図上に表示させます。
22 : コントロールレイヤーに追加して、右上のアイコンからオン・オフをコントロールすることができます。

HTMLとCSS
<!DOCTYPE html>
<html lang="ja">
<head>
    <meta charset="UTF-8">
    <meta http-equiv="X-UA-Compatible" content="IE=edge">
    <meta name="viewport" content="width=device-width, initial-scale=1.0">
    <title>leaflet</title>
    <link rel="stylesheet" href="https://unpkg.com/leaflet@1.9.2/dist/leaflet.css"
     integrity="sha256-sA+zWATbFveLLNqWO2gtiw3HL/lh1giY/Inf1BJ0z14="
     crossorigin=""/>
     <link rel="stylesheet" href="style.css">
</head>
<body>

    <div id="myMap"></div>

    <script src="https://unpkg.com/leaflet@1.9.2/dist/leaflet.js"
     integrity="sha256-o9N1jGDZrf5tS+Ft4gbIK7mYMipq9lqpVJ91xHSyKhg="
     crossorigin=""></script>
     <script src="script.js"></script>
</body>
</html>
* {
margin: 0;
padding: 0;
box-sizing: border-box;
}
#myMap {
height: 100vh;
width: 100%;
}


